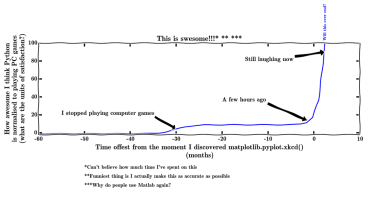
I was browsing the Global Trajectory Competition portal looking for some slides for work in the morning and came across a way of making XKCD-style images in Python. I used to love and use Python a lot, even for fun, anyway. But now it's even more fun!
This will correlate well with how much time I'll spend writing Python scripts for the hell of it.
This will correlate well with how much time I'll spend writing Python scripts for the hell of it.
I wonder how my PhD thesis committee will react when they see a thesis with this type of plots in it.
If you want the source code that reproduces this plot it's on my GitHub. In the same repository you can get a high-res version of the plot (I can't believe I actually pay them to host this and can't seem to upload high-res images).
 RSS Feed
